Modern spatial analysis · HARE Revisited

Maps, DEM &
HARE Revisited

Terrain · Catchment · Land · Hydrology · Irrigation

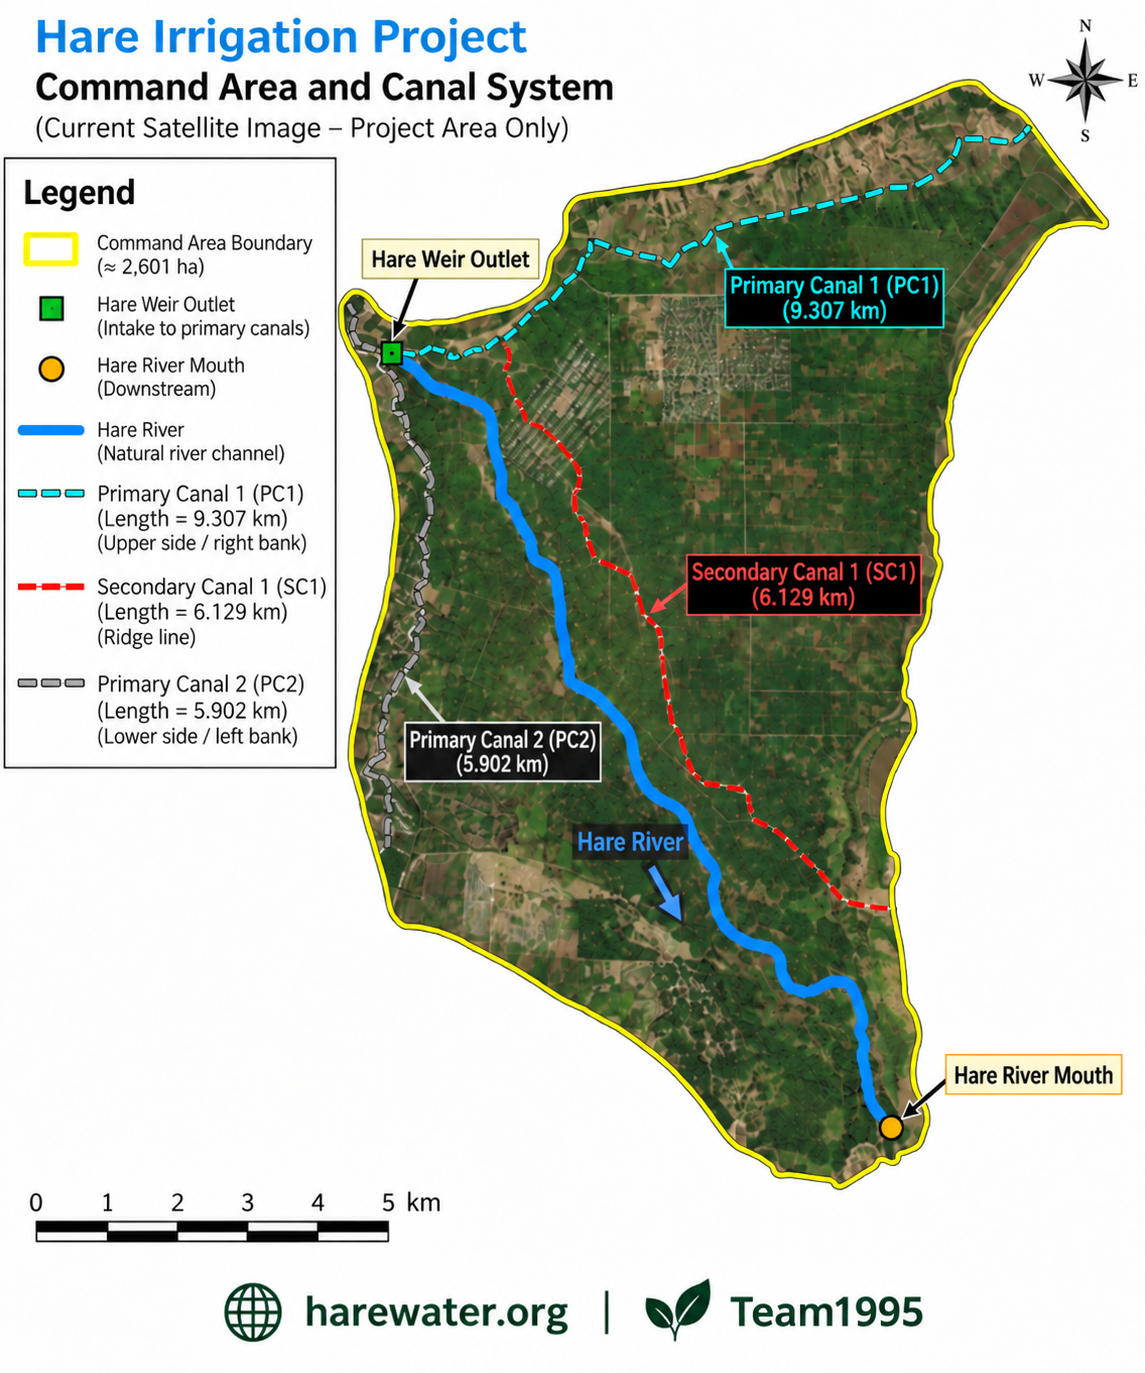
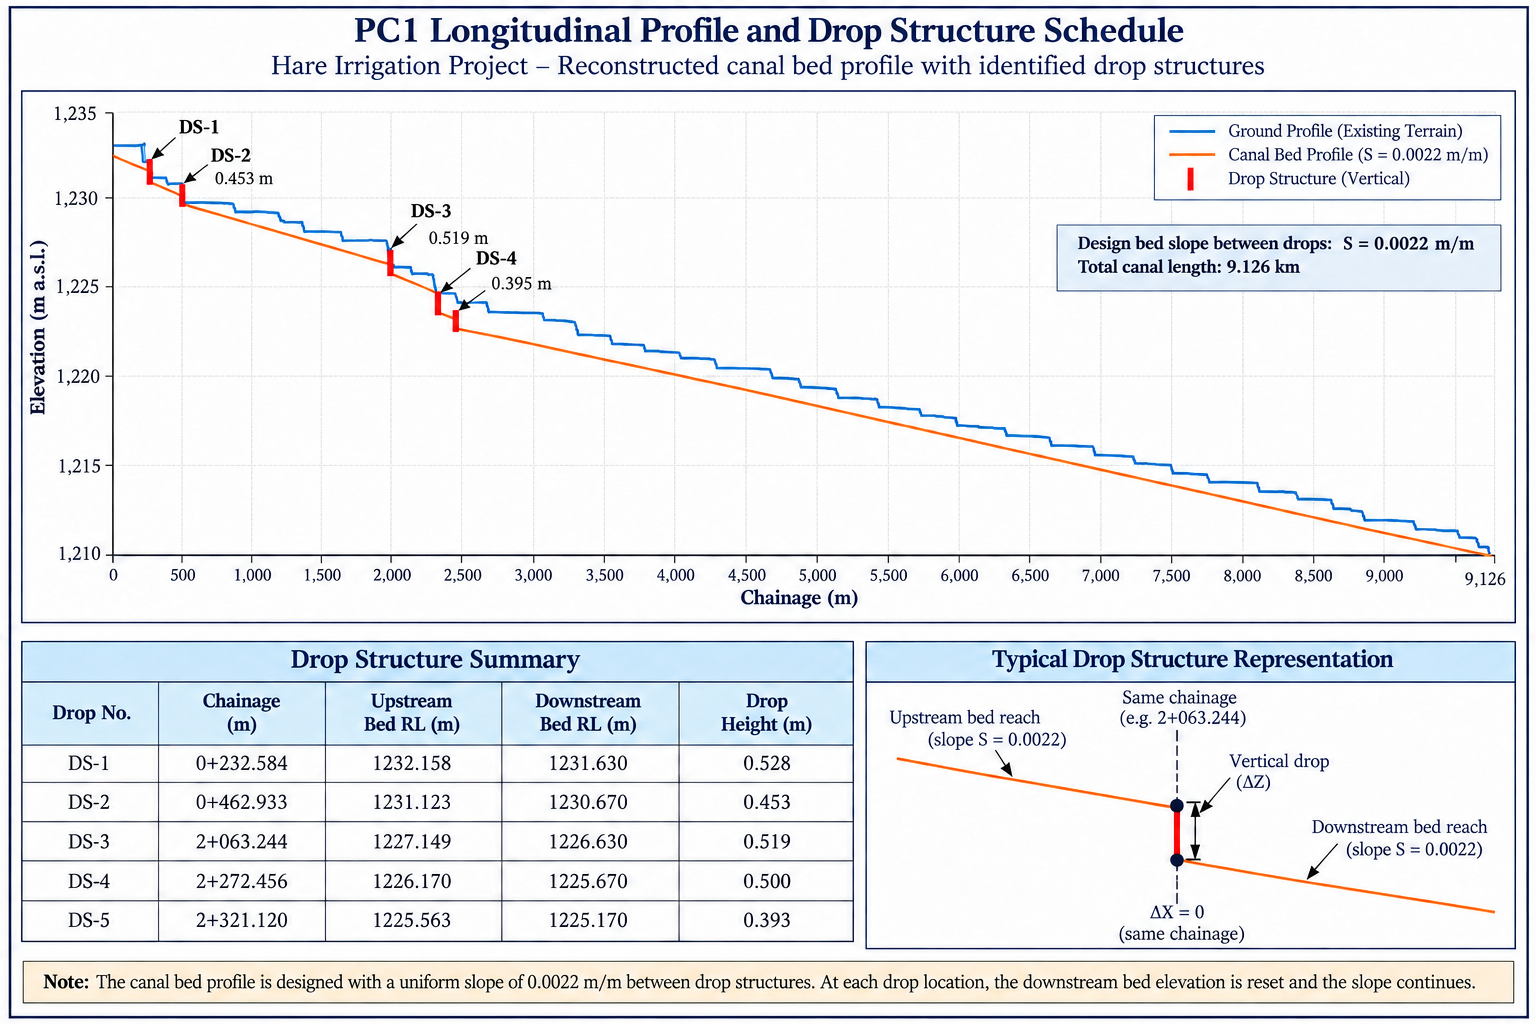
This section is the geospatial and engineering-visualization workspace for the modern reassessment of HARE. The spatial archive includes watershed-scale land use / land cover, drainage, relief, contours, slope and rainfall products together with dedicated command-area maps. The 2026 command-area canal-system map now places Primary Canal 1, Primary Canal 2, Secondary Canal 1 and the Hare River directly on current satellite imagery. Newly published PC1 and PC2 longitudinal-profile figures document the designed canal-bed profiles and drop structures, while reconstructed upstream views document the HARE weir, intake and headworks. A separate rainfall-analysis viewer presents the monthly rainfall figures and key watershed statistics without crowding the page.

First Published HARE Spatial Product Land use / land cover · drainage · relief · reference points
Published
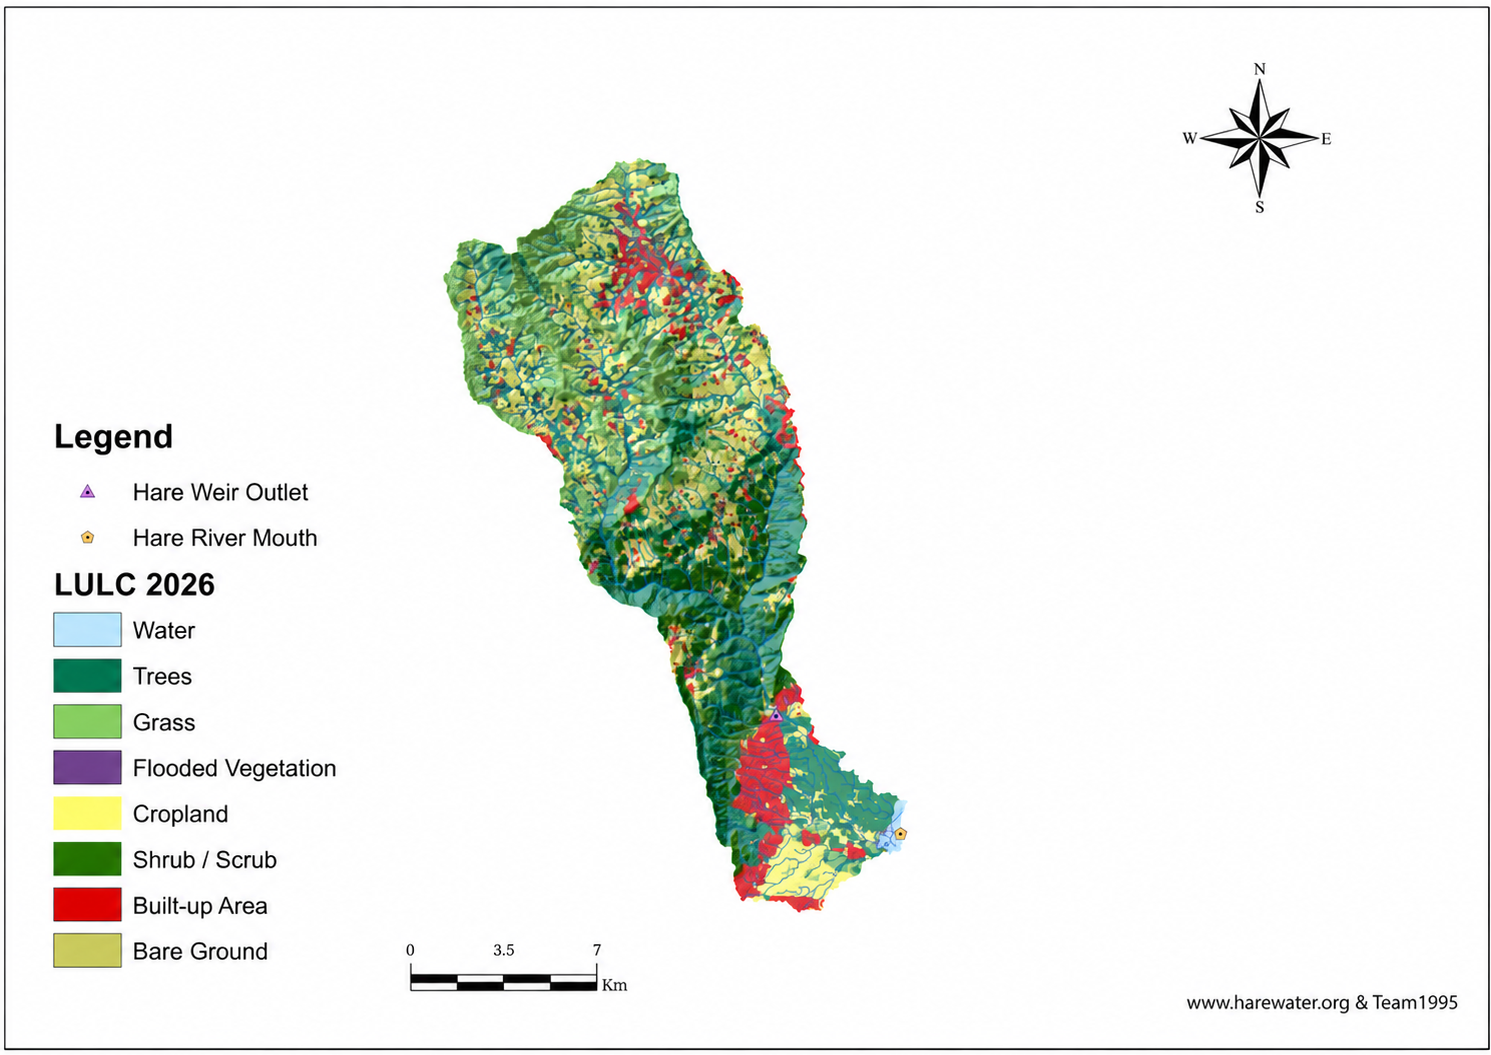
Hare Watershed land use and land cover, drainage network and relief map showing the Hare Weir outlet and Hare River mouth
HARE Watershed · integrated presentation map · team1995
HARE GIS map library

Published Maps & Statistical Figures

The HARE spatial products and rainfall-analysis figures are presented as separate full-size figures rather than stacking several large maps on one page. Select a product below and the viewer will display only that figure at large size. This keeps the archive clean, fast and easy to extend while preserving every map as an independent technical output.

Land Use/Land Cover, Drainage Network and Relief Integrated GIS map · HARE Revisited · team1995
Published

Integrated HARE watershed presentation showing land use / land cover over terrain relief, the drainage network, watershed boundary, Hare Weir outlet and Hare River mouth.

Presentation method: one large figure is shown at a time. The other images remain separate files and are loaded only when selected, preventing the page from becoming long or visually clumsy.
Hydraulic structures · HARE Revisited

Reconstructed Weir, Intake & Headworks

These engineering visualizations reconstruct the upstream arrangement of the HARE diversion works from the available field photographs, video evidence and surviving structural details. They are presented separately from the GIS map library because they document the physical hydraulic structures rather than spatial-analysis products.

Engineering reconstruction 01

Upstream Intake Structure

Reconstructed upstream view of the Hare Irrigation Project intake structure showing the canal intake opening and excess-water return gate.

Reconstructed upstream view of the intake arrangement. The main opening conveys diverted water into the irrigation canal, while the adjacent gate provides a controlled return path toward the river when excess water reaches the intake area.

Engineering reconstruction 02

Upstream Weir & Headworks

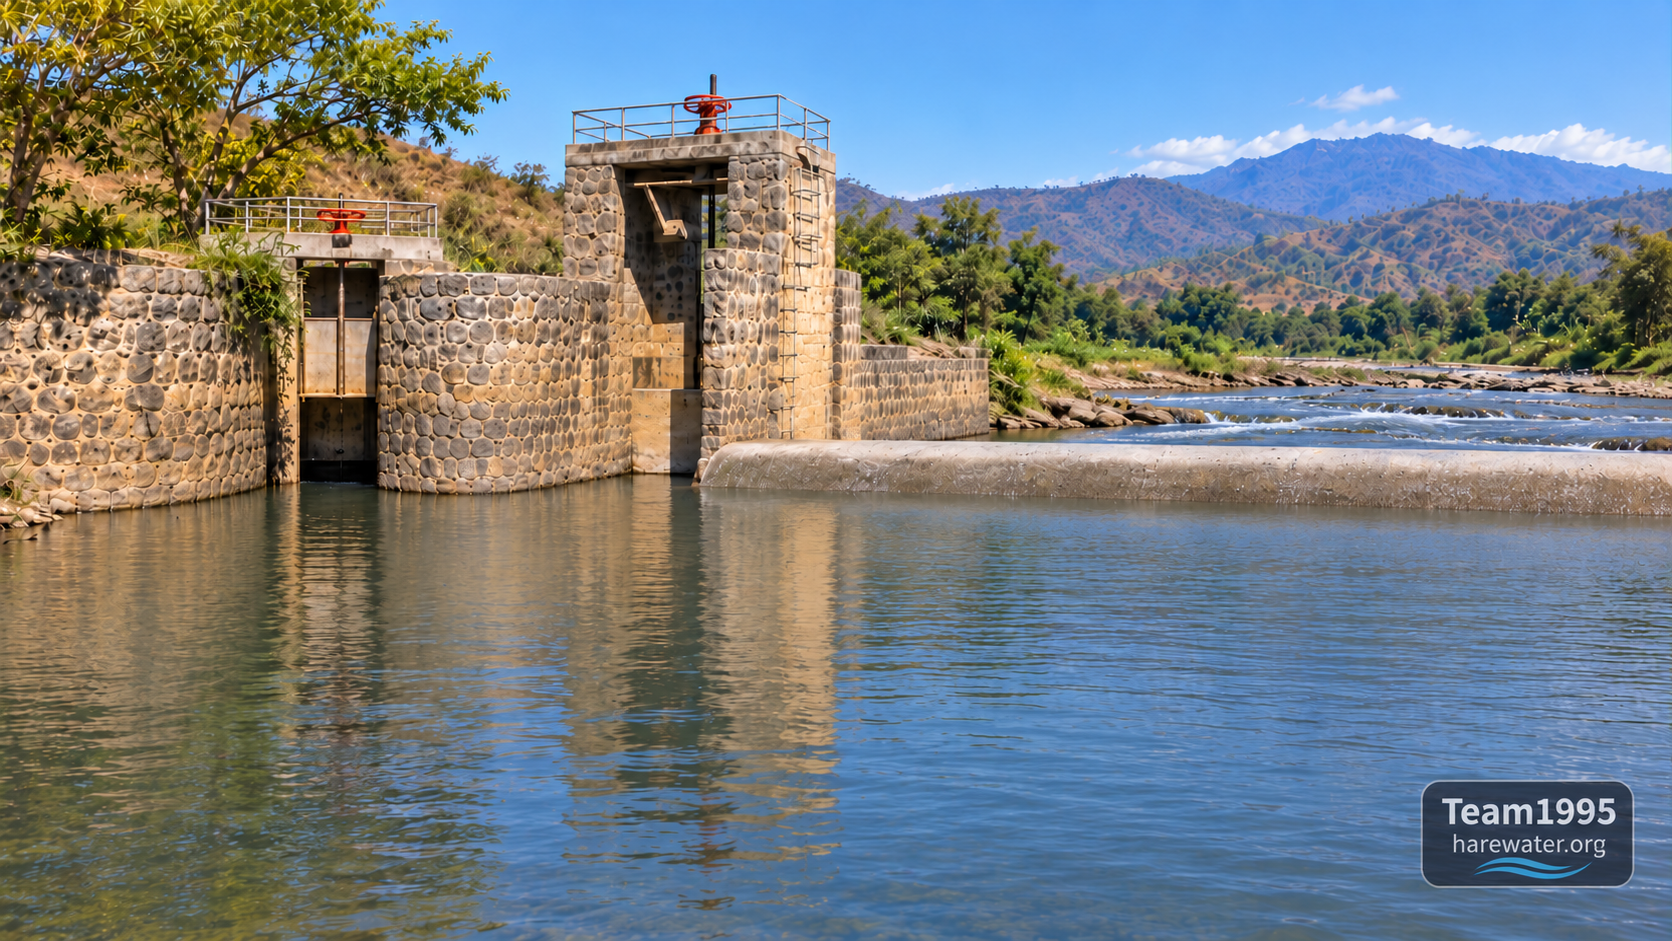
Reconstructed upstream view of the Hare Irrigation Project weir and headworks showing the intake structure, sluice gate and operating wheels.

Reconstructed upstream view of the diversion weir and left-bank headworks. The intake structure is shown on the left, with the intake-gate operating wheel directly above its gate and the sluice-gate operating mechanism positioned above the sluice opening behind it.

Reconstruction note: these images are interpretive engineering reconstructions prepared from the surviving photographic and video record. They are intended to document the observed configuration of the HARE diversion structures and should not be read as original as-built drawings.
1990 rainfall analysis

Monthly Rainfall, Seasonal Pattern & Watershed Statistics

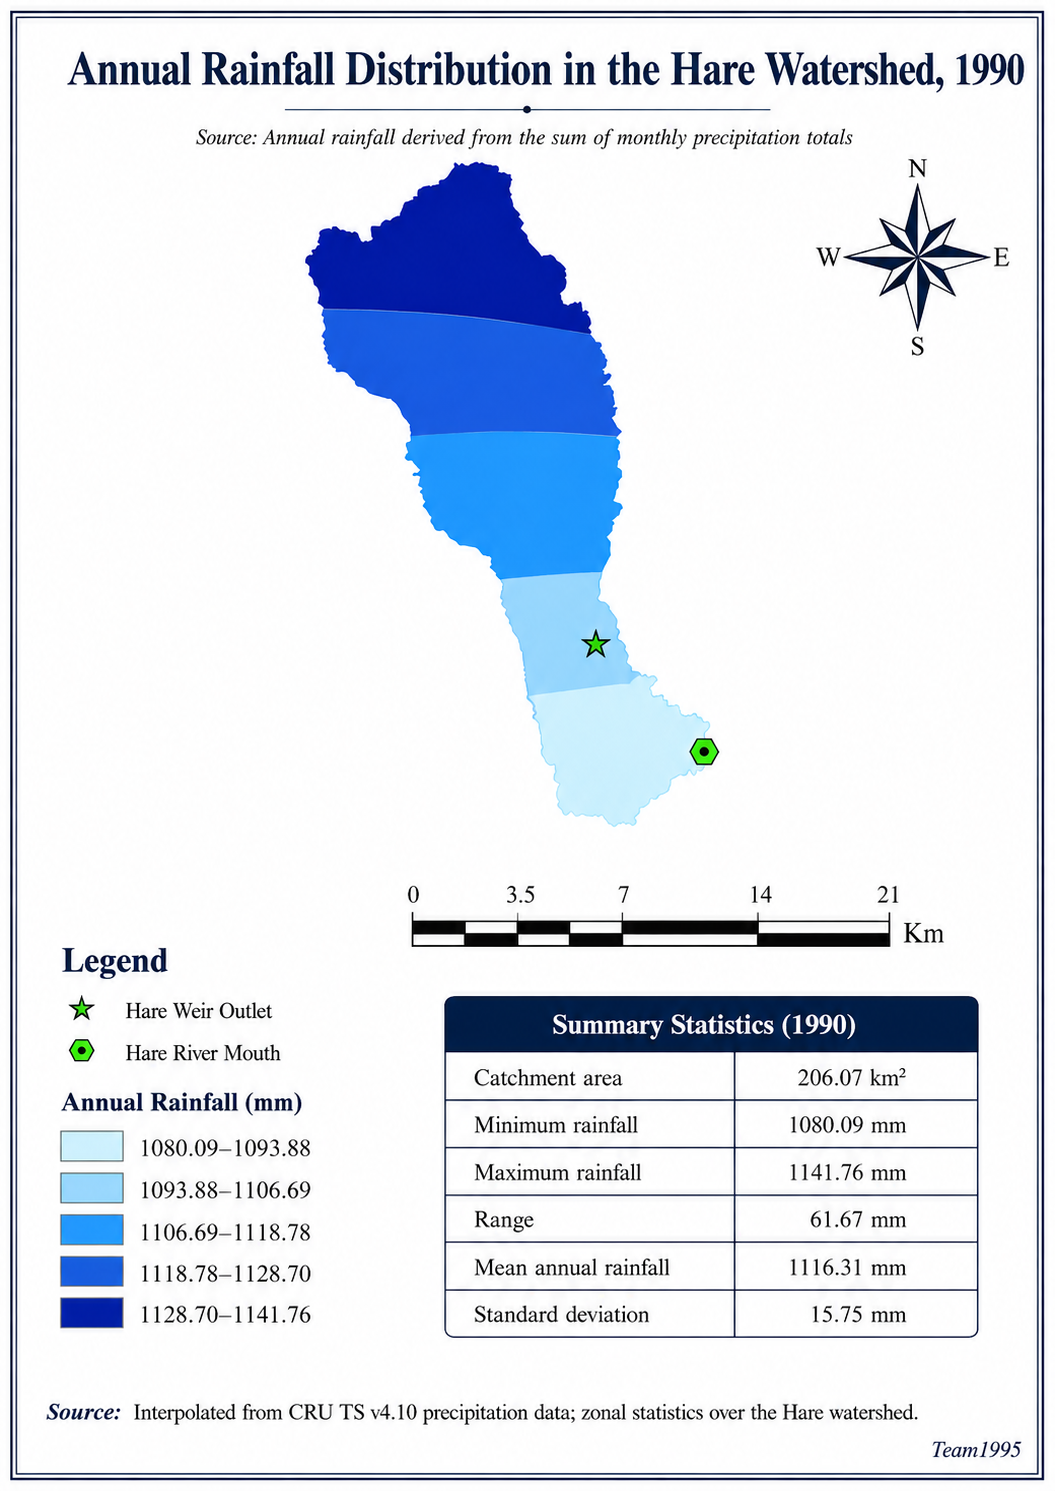
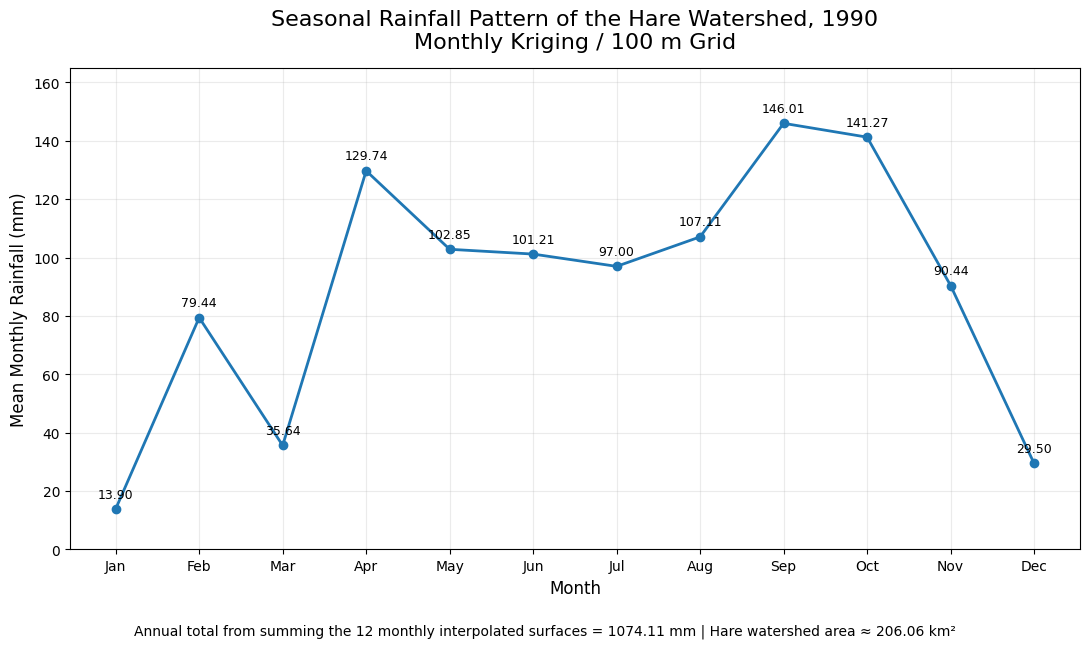
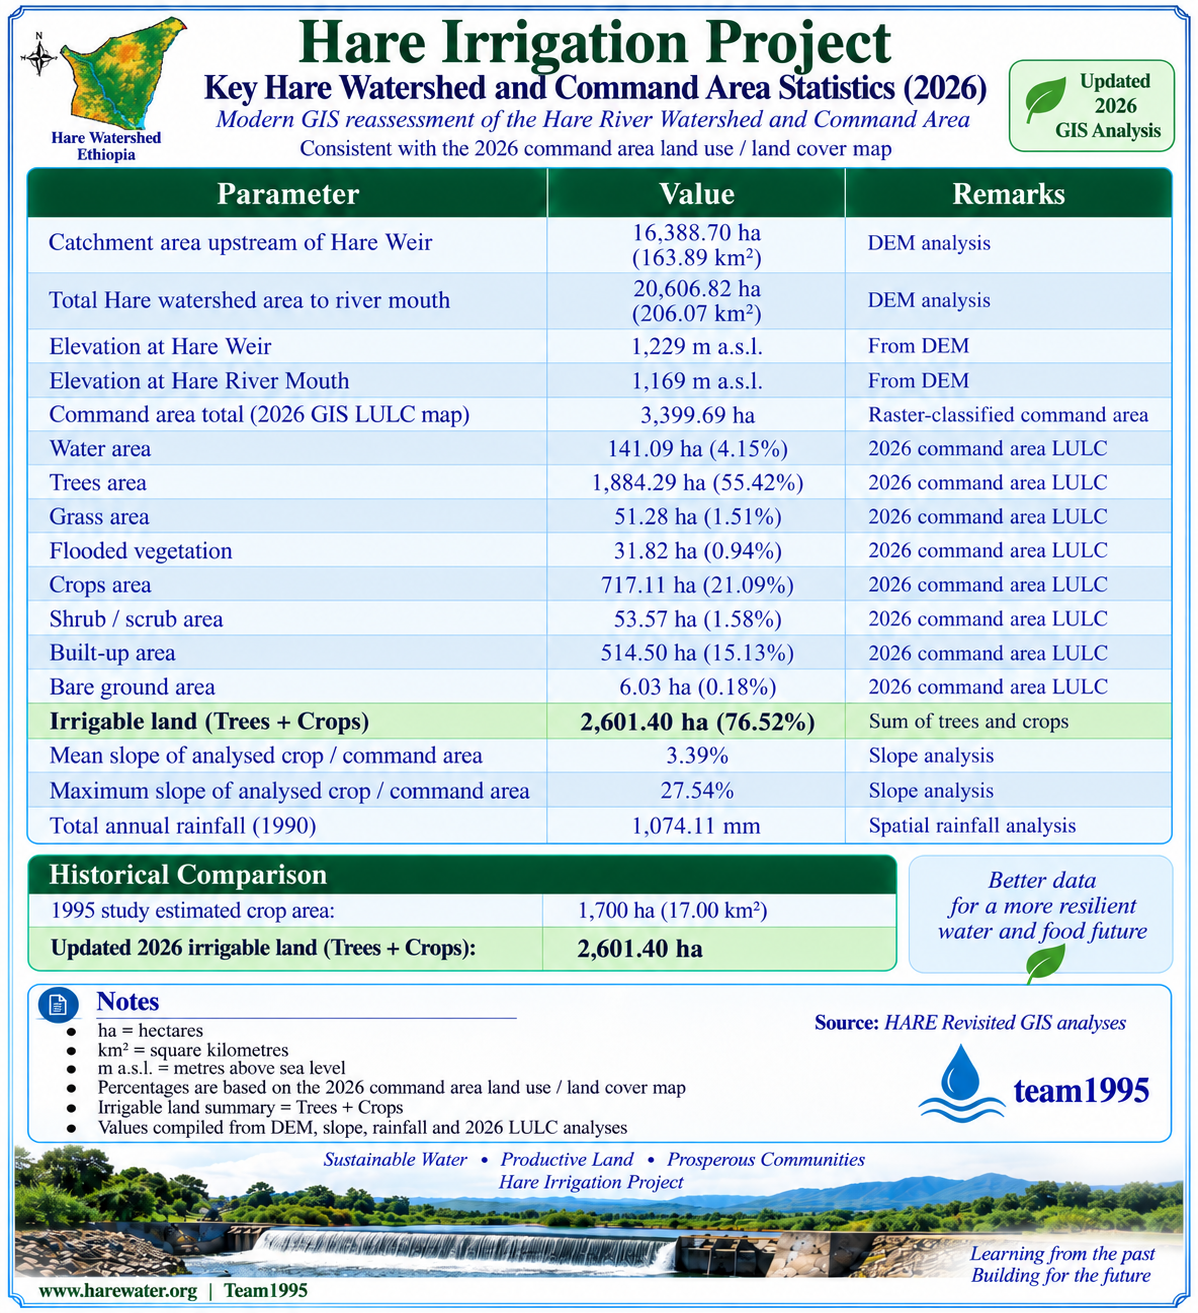
The 1990 annual rainfall map in the main GIS library is supported by three separate analytical figures. Select a figure below to view the monthly rainfall bar chart, the seasonal rainfall line graph or the consolidated key watershed statistics. Only one large figure is displayed at a time, preserving a clean page while keeping each image fully readable.

Hare Watershed Monthly Rainfall, 1990 Monthly rainfall bar chart · HARE Revisited · team1995
Published

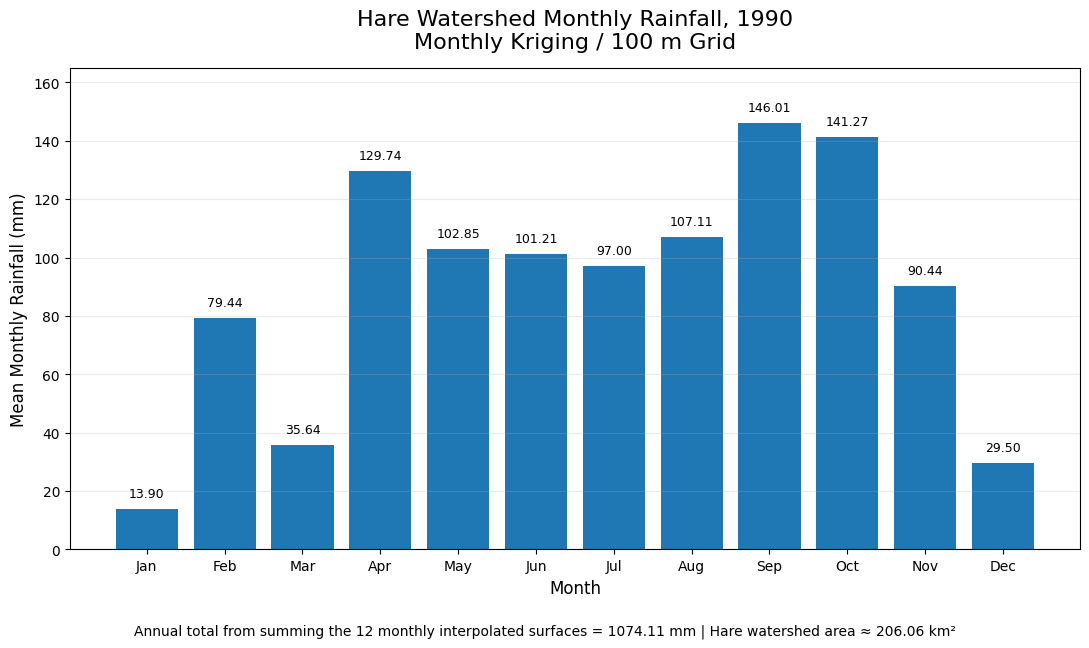
Monthly mean rainfall over the Hare Watershed in 1990. The twelve monthly values sum to a total annual rainfall of 1,074.11 mm.

Total watershed area 206.07 km²
Hare Weir catchment 163.89 km²
Total annual rainfall · 1990 1,074.11 mm
Mean analysed crop/command slope 3.39%
Presentation method: the rainfall map remains an independent GIS product in the main library, while these three supporting figures are grouped here in a second viewer. This avoids stacking several large images vertically and leaves room for later rainfall years, hydrological graphs and checked statistical tables.
Current status

A Growing Spatial Archive with Separate Published Products

The HARE spatial archive now separates its major cartographic, hydrological and engineering products so each can be examined clearly at full size. The main library contains thirteen published products, including watershed and command-area maps, the command-area canal-system map, rainfall-design figures and the PC1/PC2 longitudinal-profile drawings, while the dedicated rainfall viewer presents the monthly bar chart, seasonal line graph and key watershed statistics.

GIS
Sixteen HARE presentation products are now organized in two clean viewers.

Thirteen maps, design figures and engineering-profile products are retained in the main library, while three supporting 1990 rainfall and watershed-statistics figures are grouped in their own viewer. Each remains independent, large and easy to examine without making the page excessively long.

Total Hare watershed area 206.07 km²
Catchment upstream of Hare Weir 163.89 km²
Total annual rainfall · 1990 1,074.11 mm
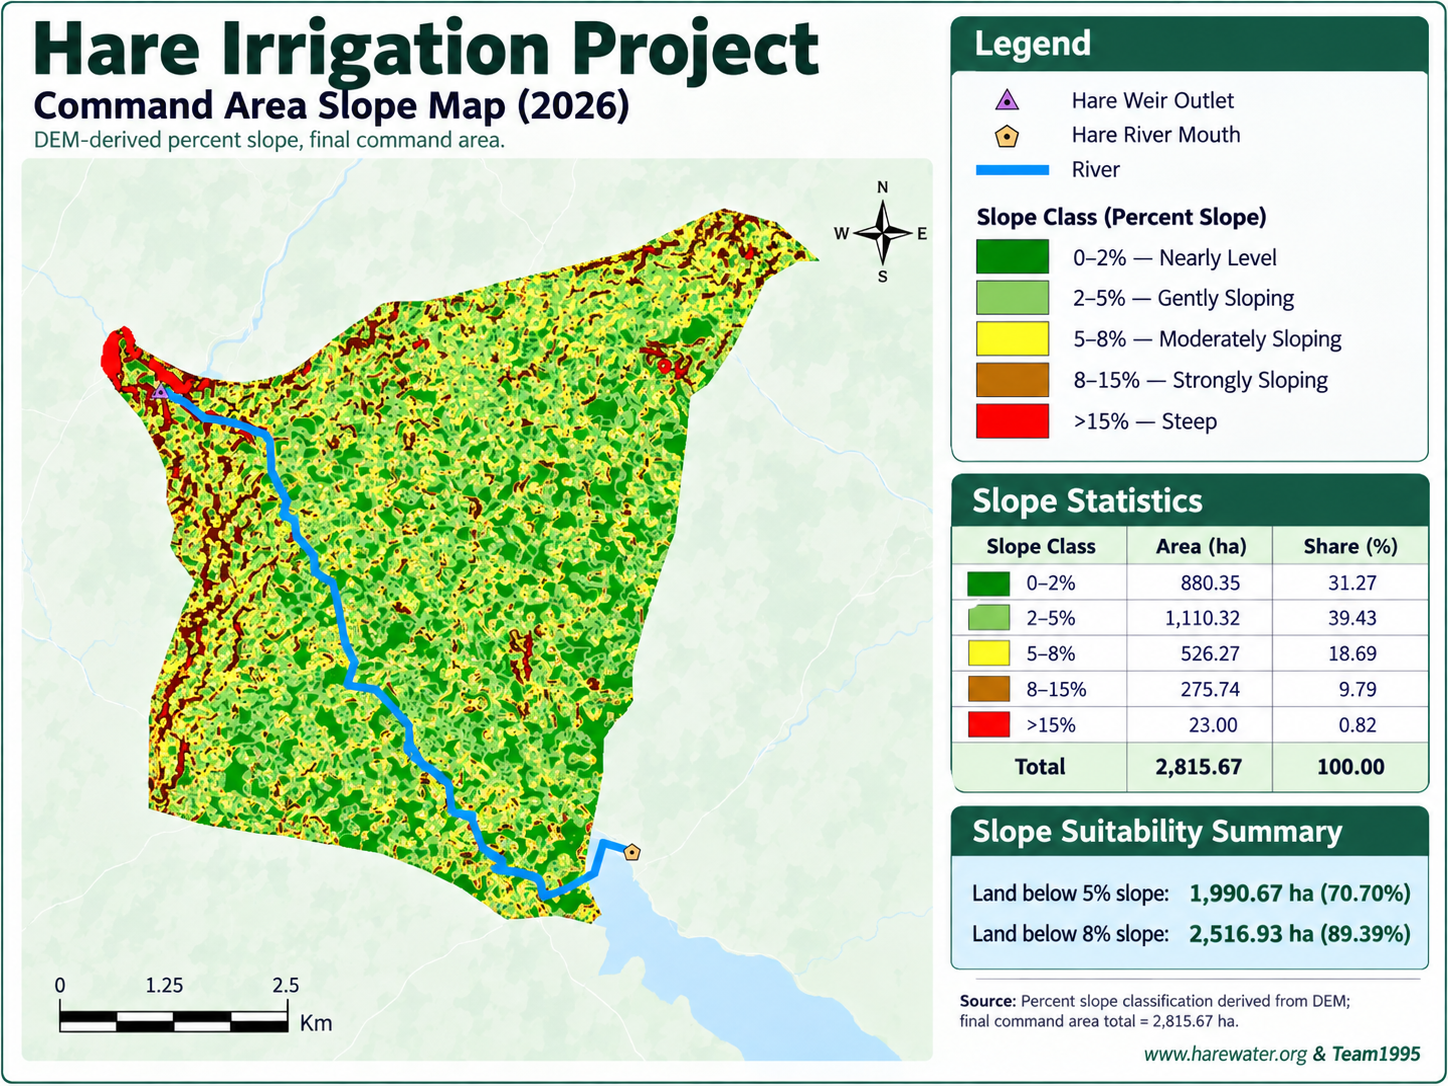
Mean analysed crop / command slope 3.39%
Spatial layers

The HARE Geospatial Analysis Set

Each layer below has a defined place in the HARE reassessment. Several products are already published as separate figures in the map library, while the remaining layers will be added progressively with verified maps, statistics, methodology and technical outputs.

01

Project Location & Catchment

Location map published · refinement ongoing

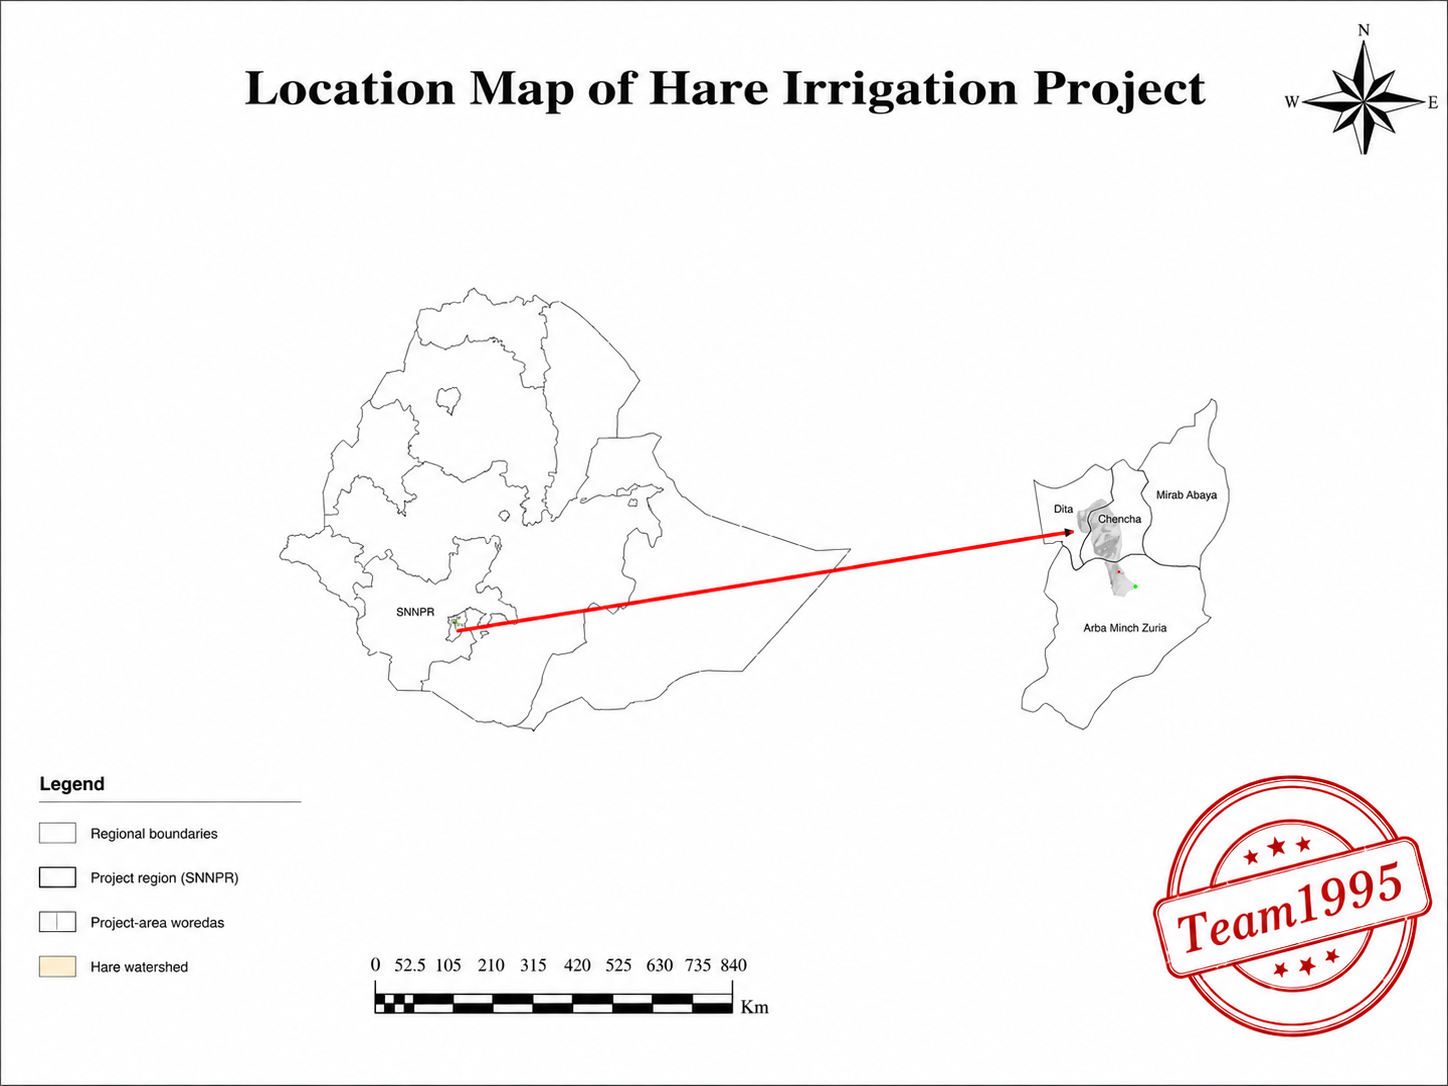
A dedicated HARE Irrigation Project location map is now published in the main map library, while the integrated watershed map continues to present the watershed boundary, drainage network, Hare Weir outlet and Hare River mouth. Additional command-area detail can be added as the archive develops.

02

Digital Elevation Model

DEM processing pending

A modern DEM will provide the elevation surface used for terrain interpretation, watershed delineation, slope analysis and drainage extraction.

03

Elevation & Hillshade

Hillshade & contour map published

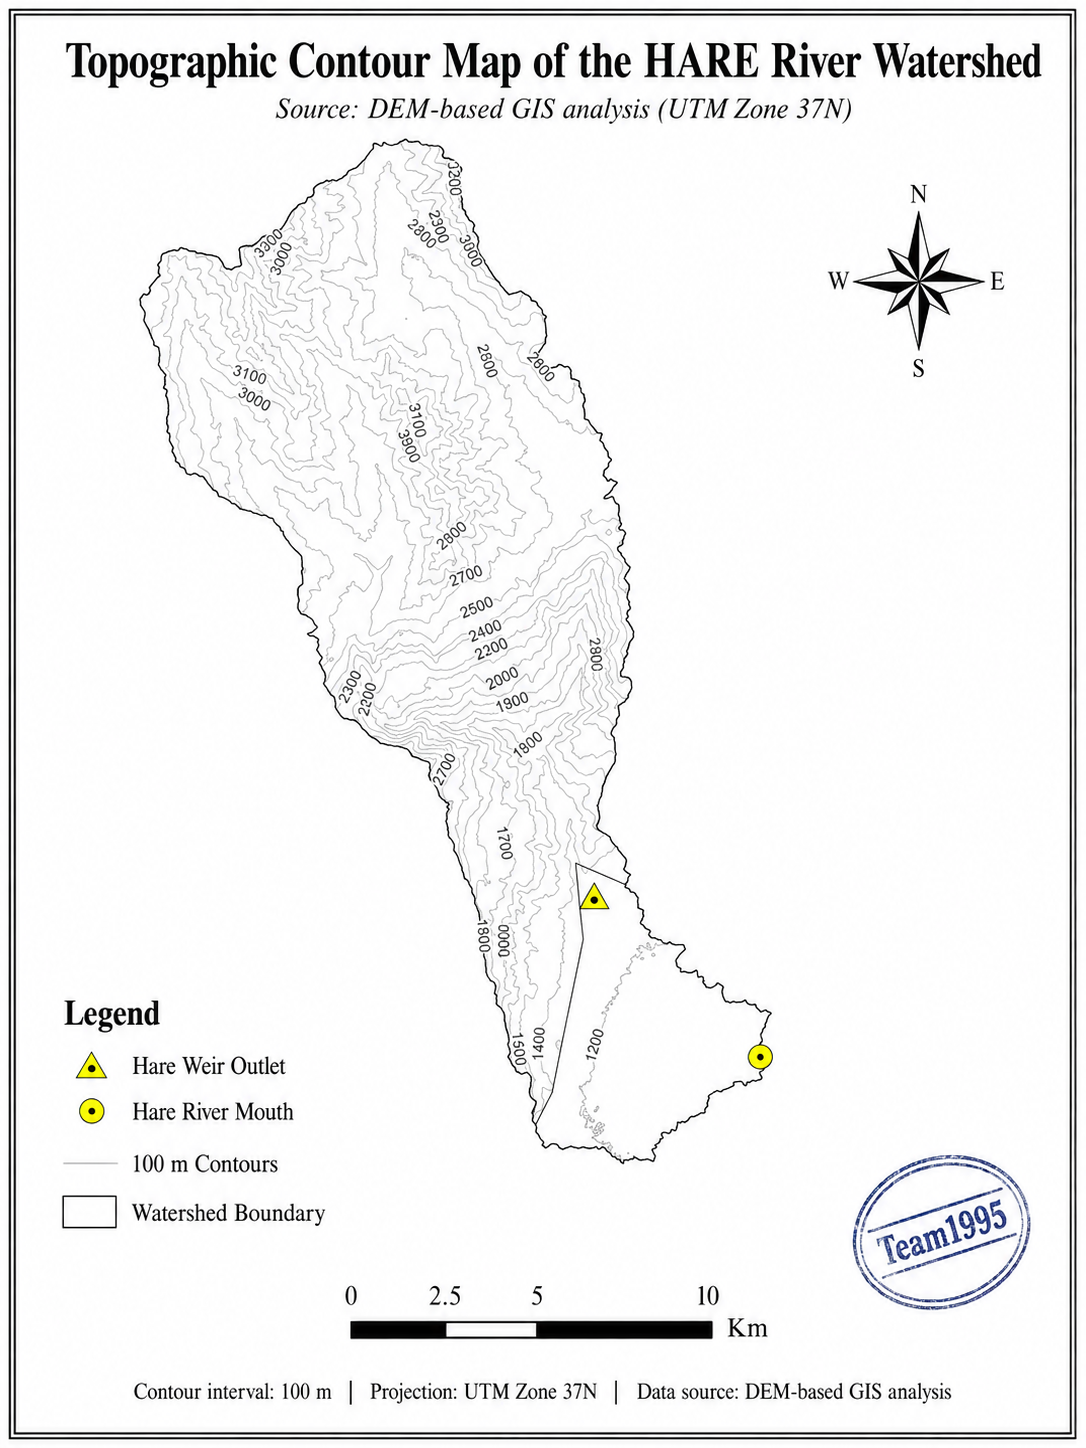
Hillshade relief is integrated into the watershed presentation map, and a dedicated contour map is now included in the published map library to document terrain form and elevation structure.

04

Slope Analysis

Watershed & command-area slope maps published

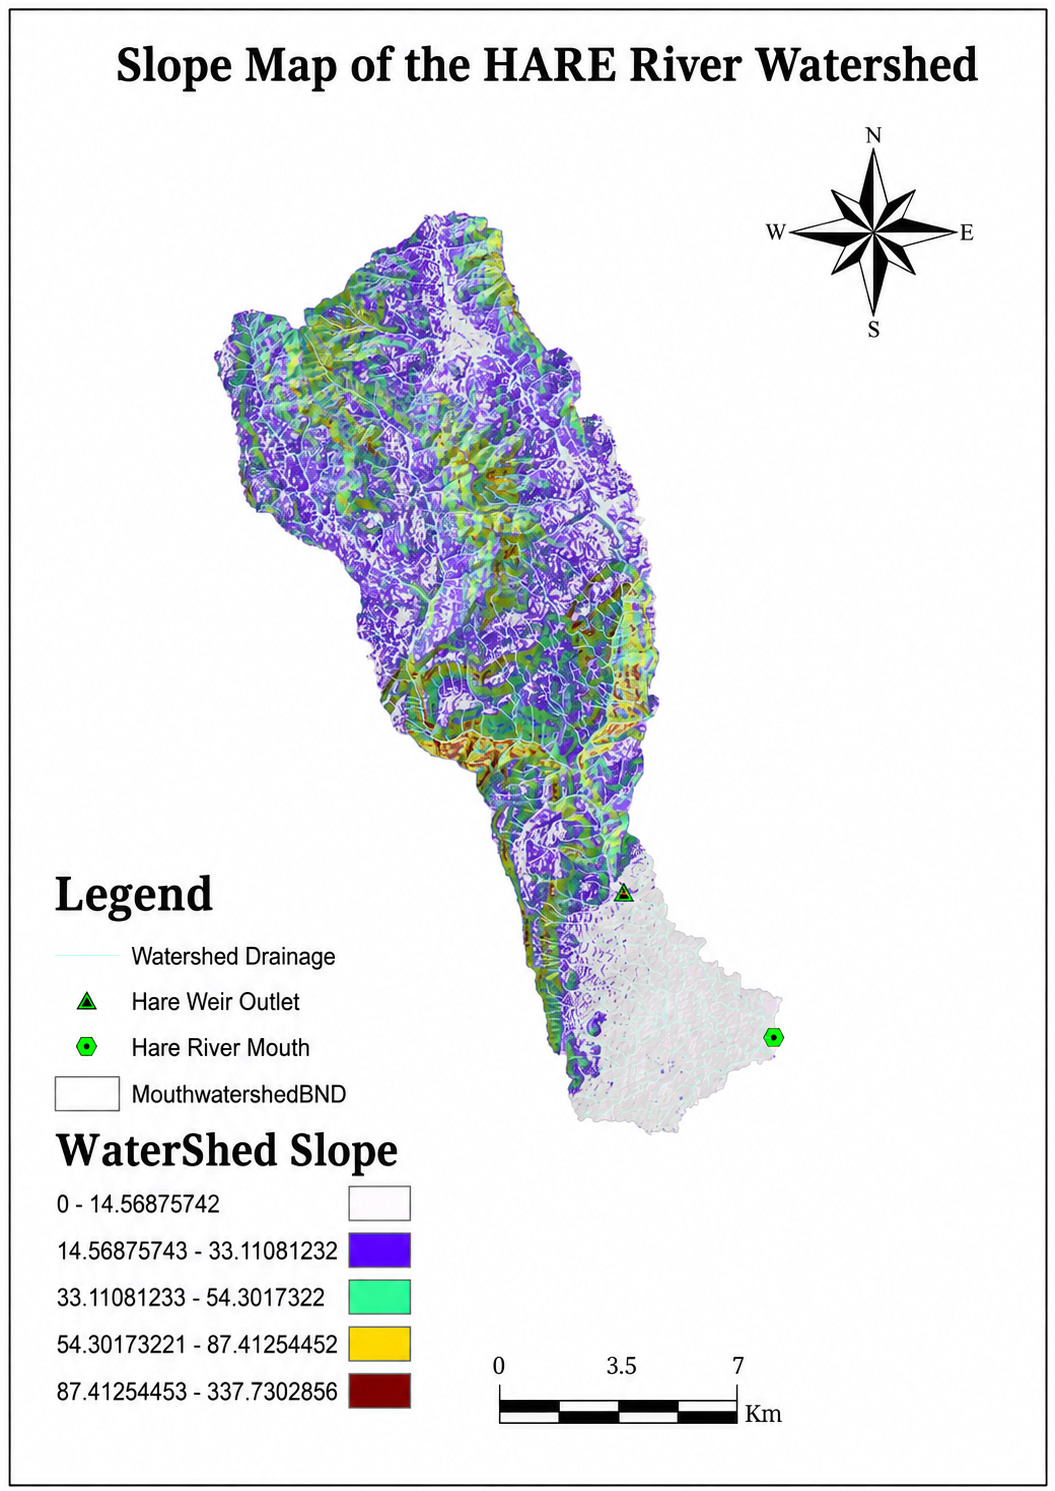
Slope analysis is now published at both watershed and command-area scales. The command-area map supports irrigation-suitability assessment and canal-alignment review by distinguishing gentle, moderate and steeper terrain within the reconstructed irrigable area.

05

Drainage Network

Drainage map published

A modern drainage network is now presented in the first integrated HARE watershed map. Flow-direction and flow-accumulation products will be documented separately as the technical analysis continues.

06

Land Use / Land Cover

Watershed & command-area maps published

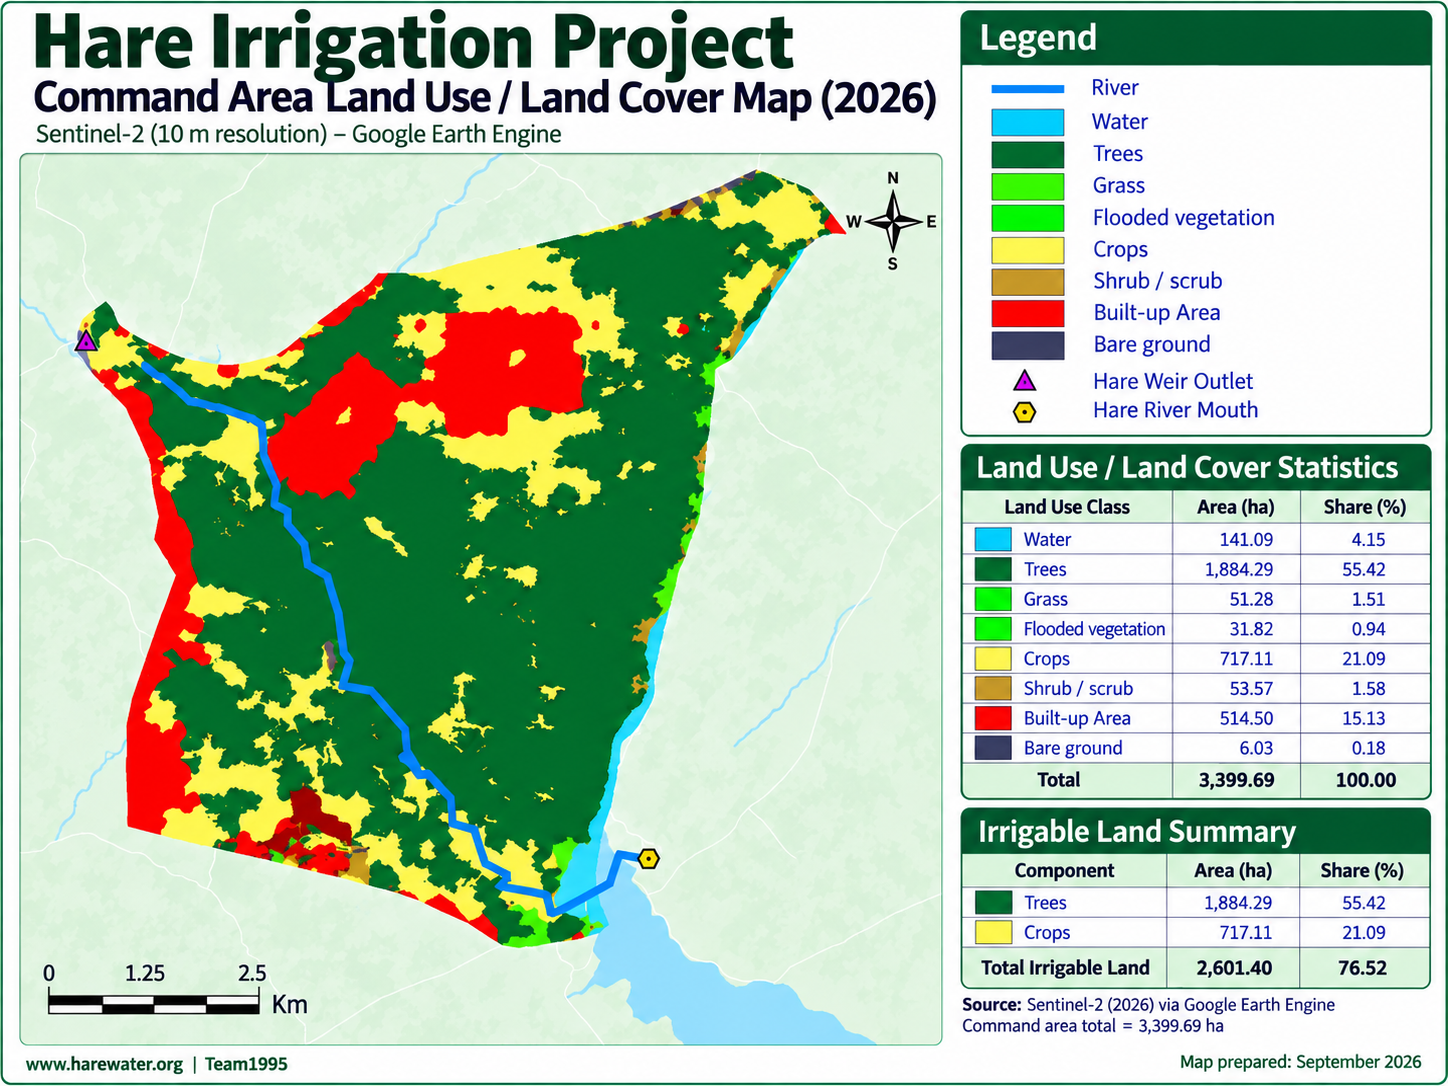
Land use / land cover is now presented at both watershed and command-area scales. The command-area figure documents the 2026 mapped classes, while the new satellite-background canal-system map shows how the primary and secondary canals relate spatially to the Hare River, settlements, cultivated land and the updated project boundary.

07

Soils & Land Suitability

Soil map published · suitability review ongoing

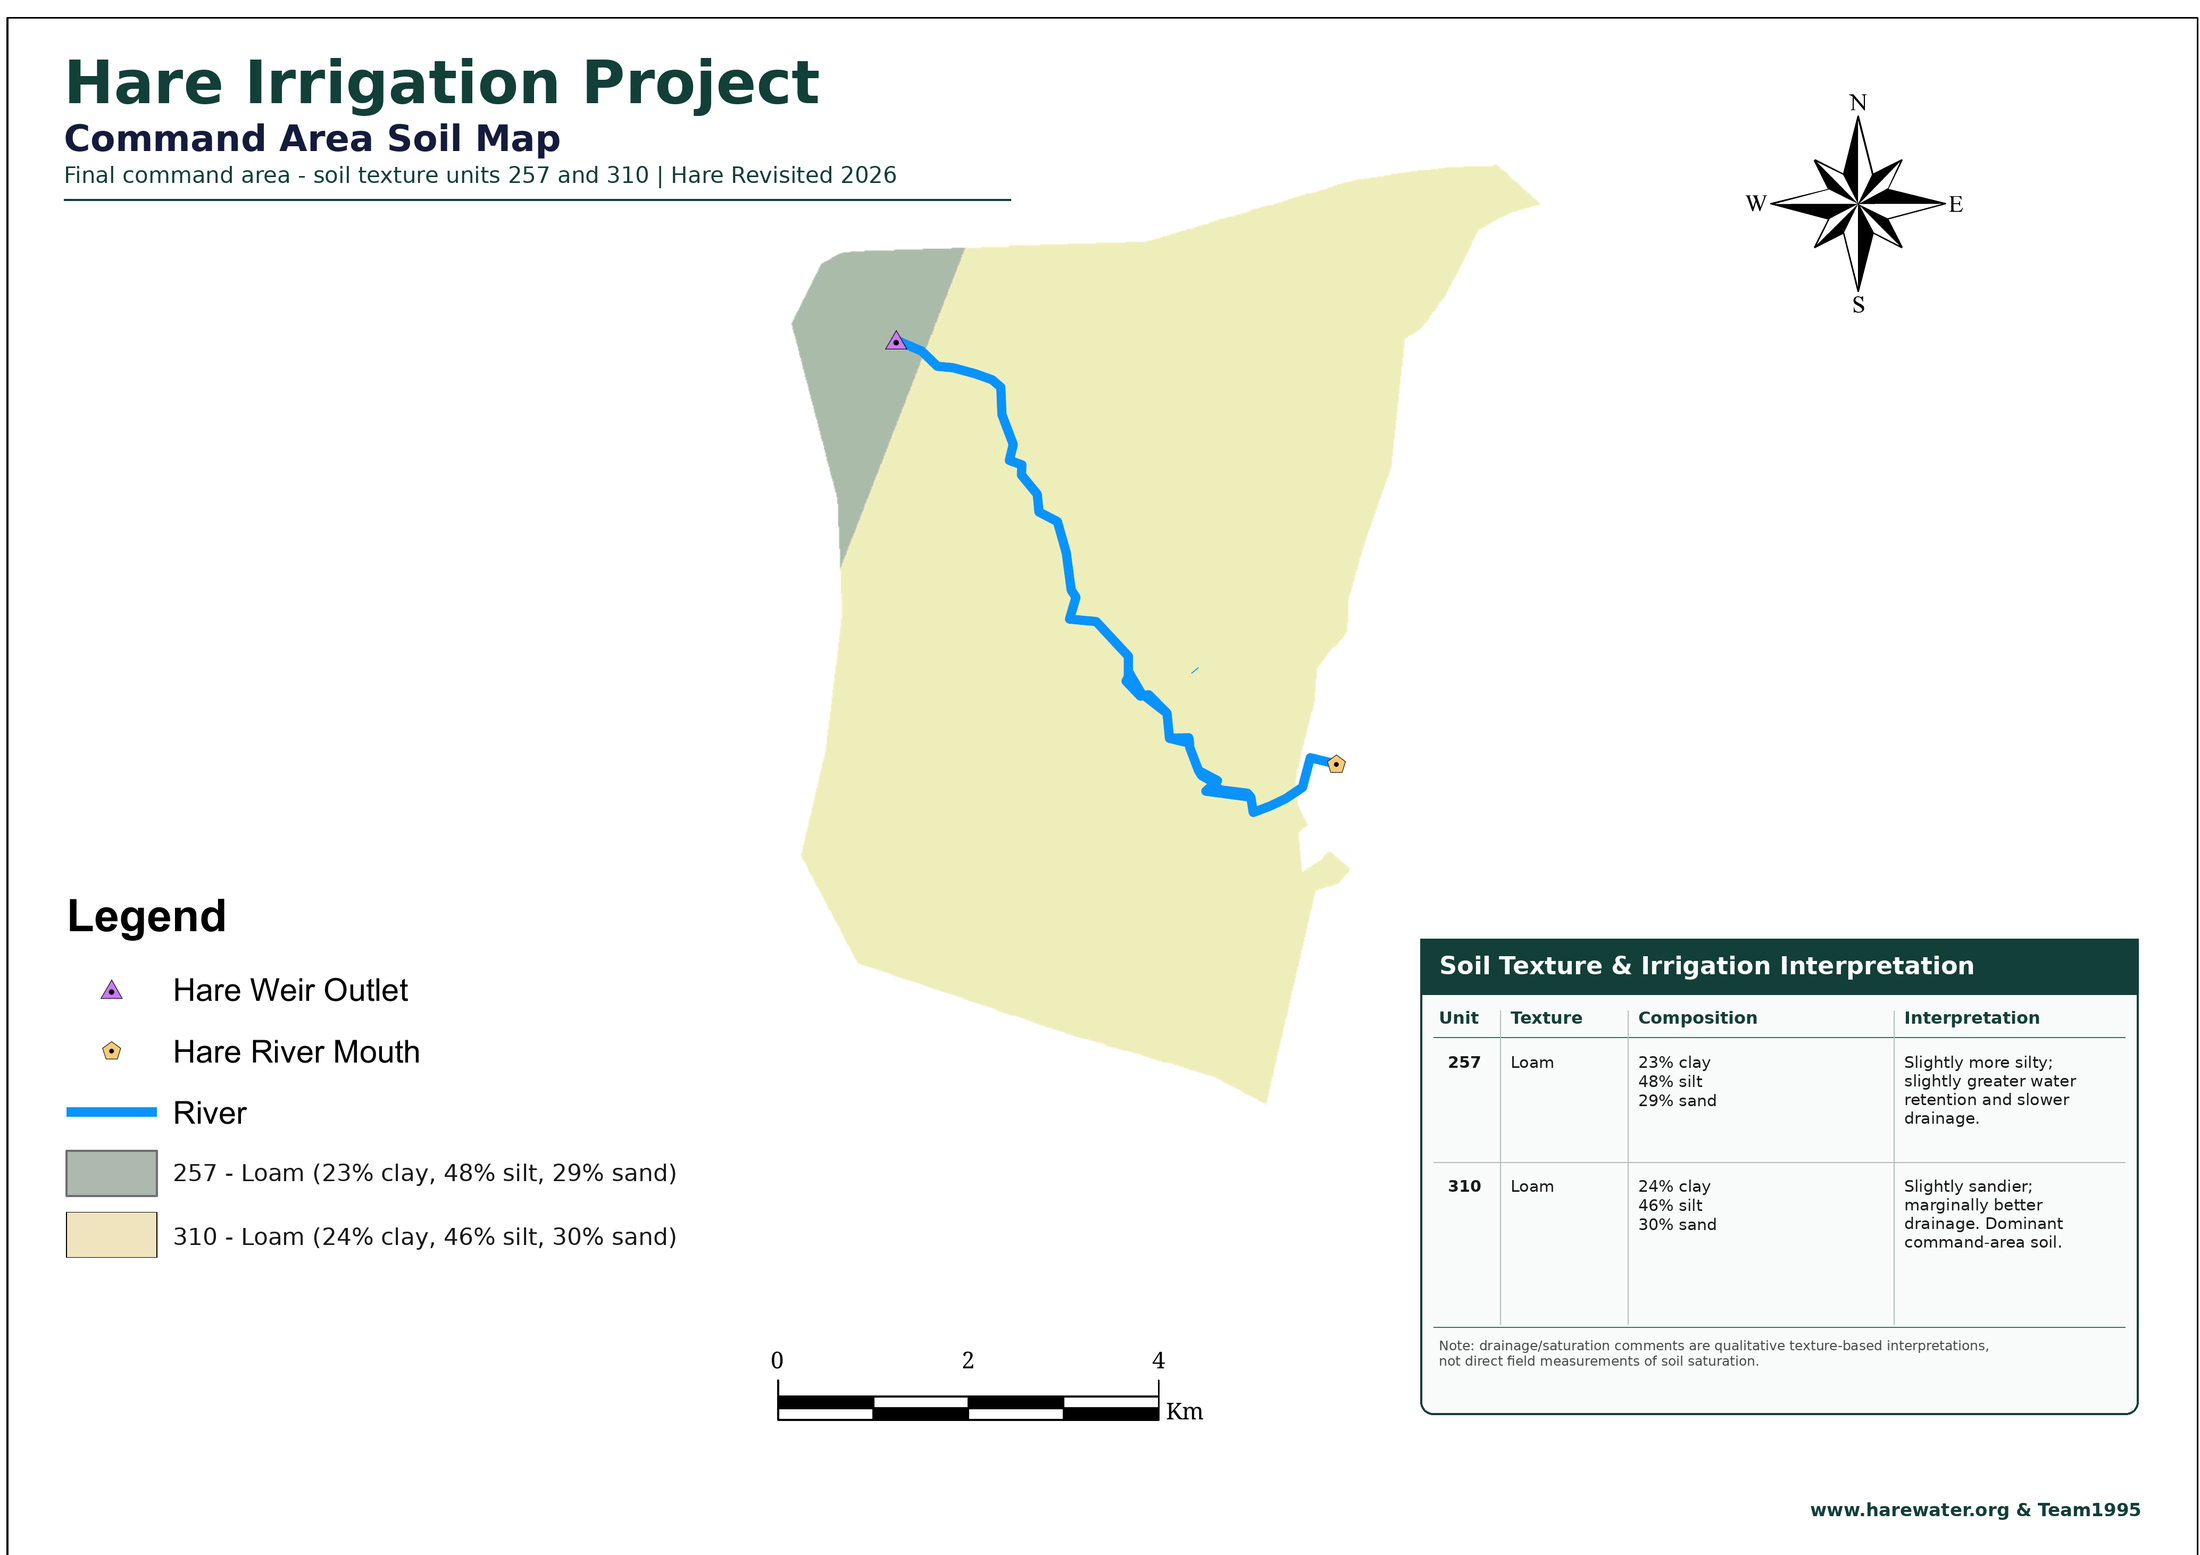
A dedicated soil map is now published for the Hare project area, documenting the two mapped loam-soil units and their slight textural differences. Terrain and irrigation criteria can be integrated progressively for the broader land-suitability review.

08

Rainfall & Hydroclimate

1990 annual & monthly analysis published

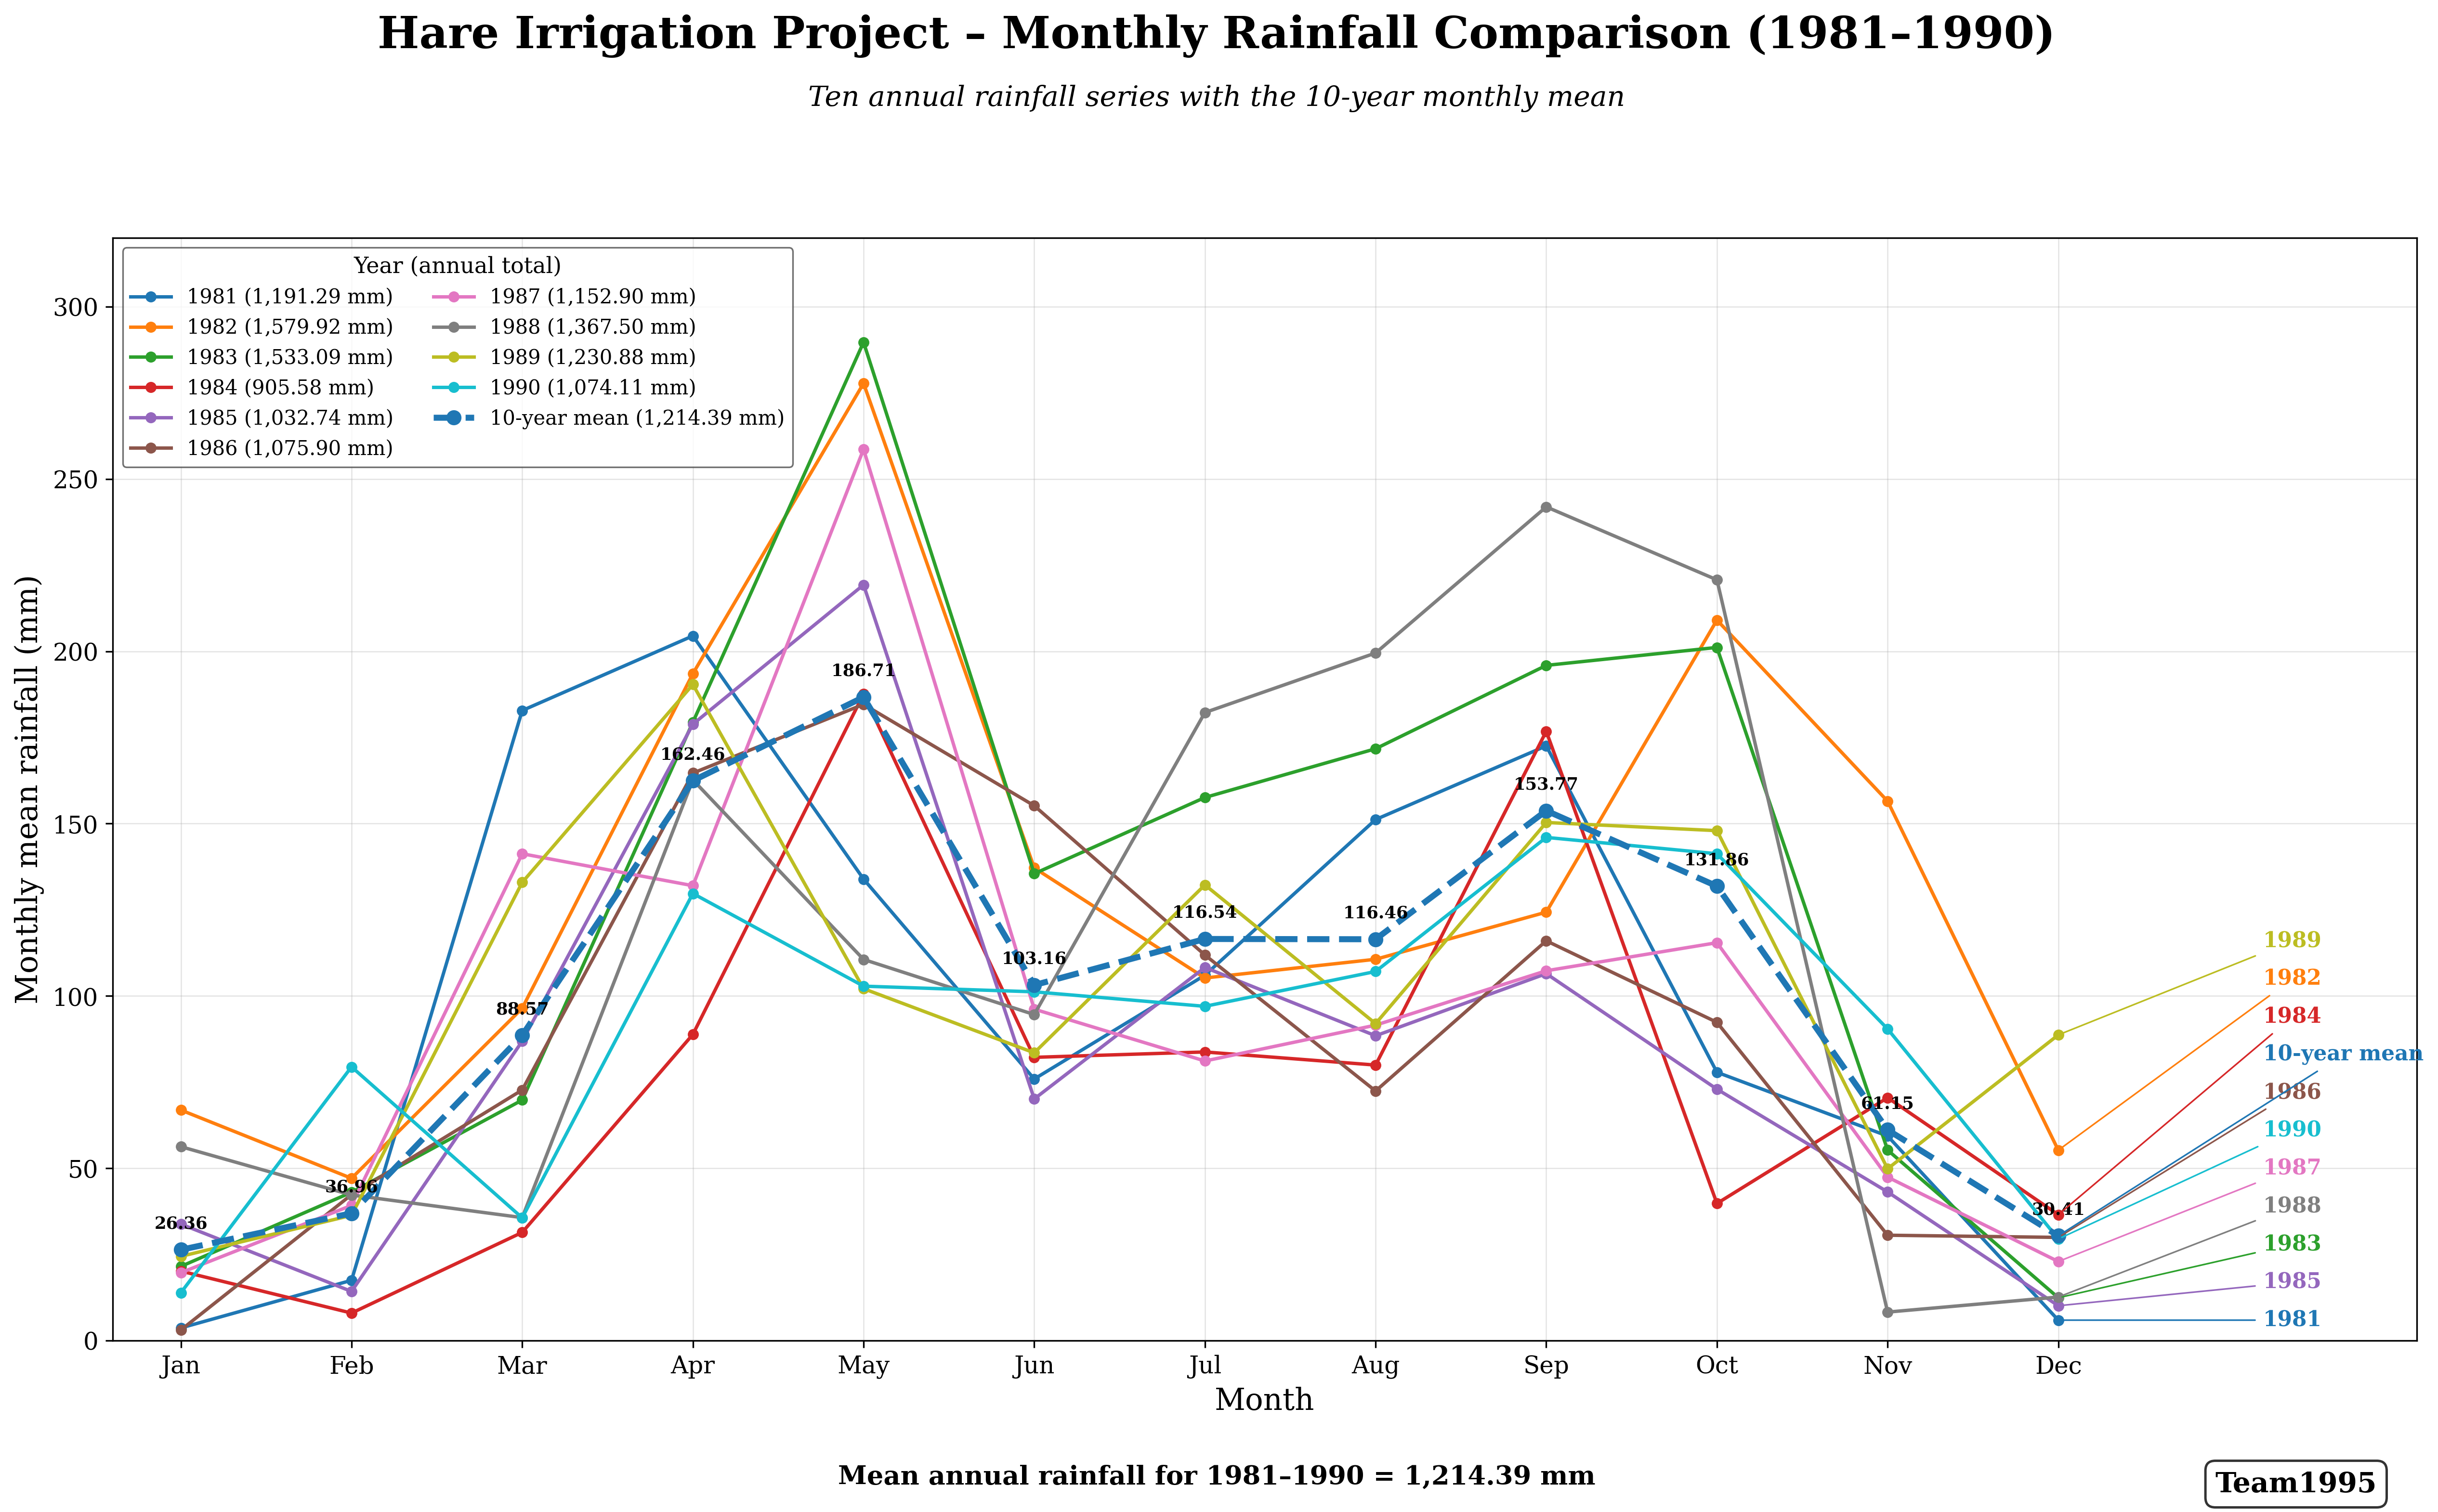
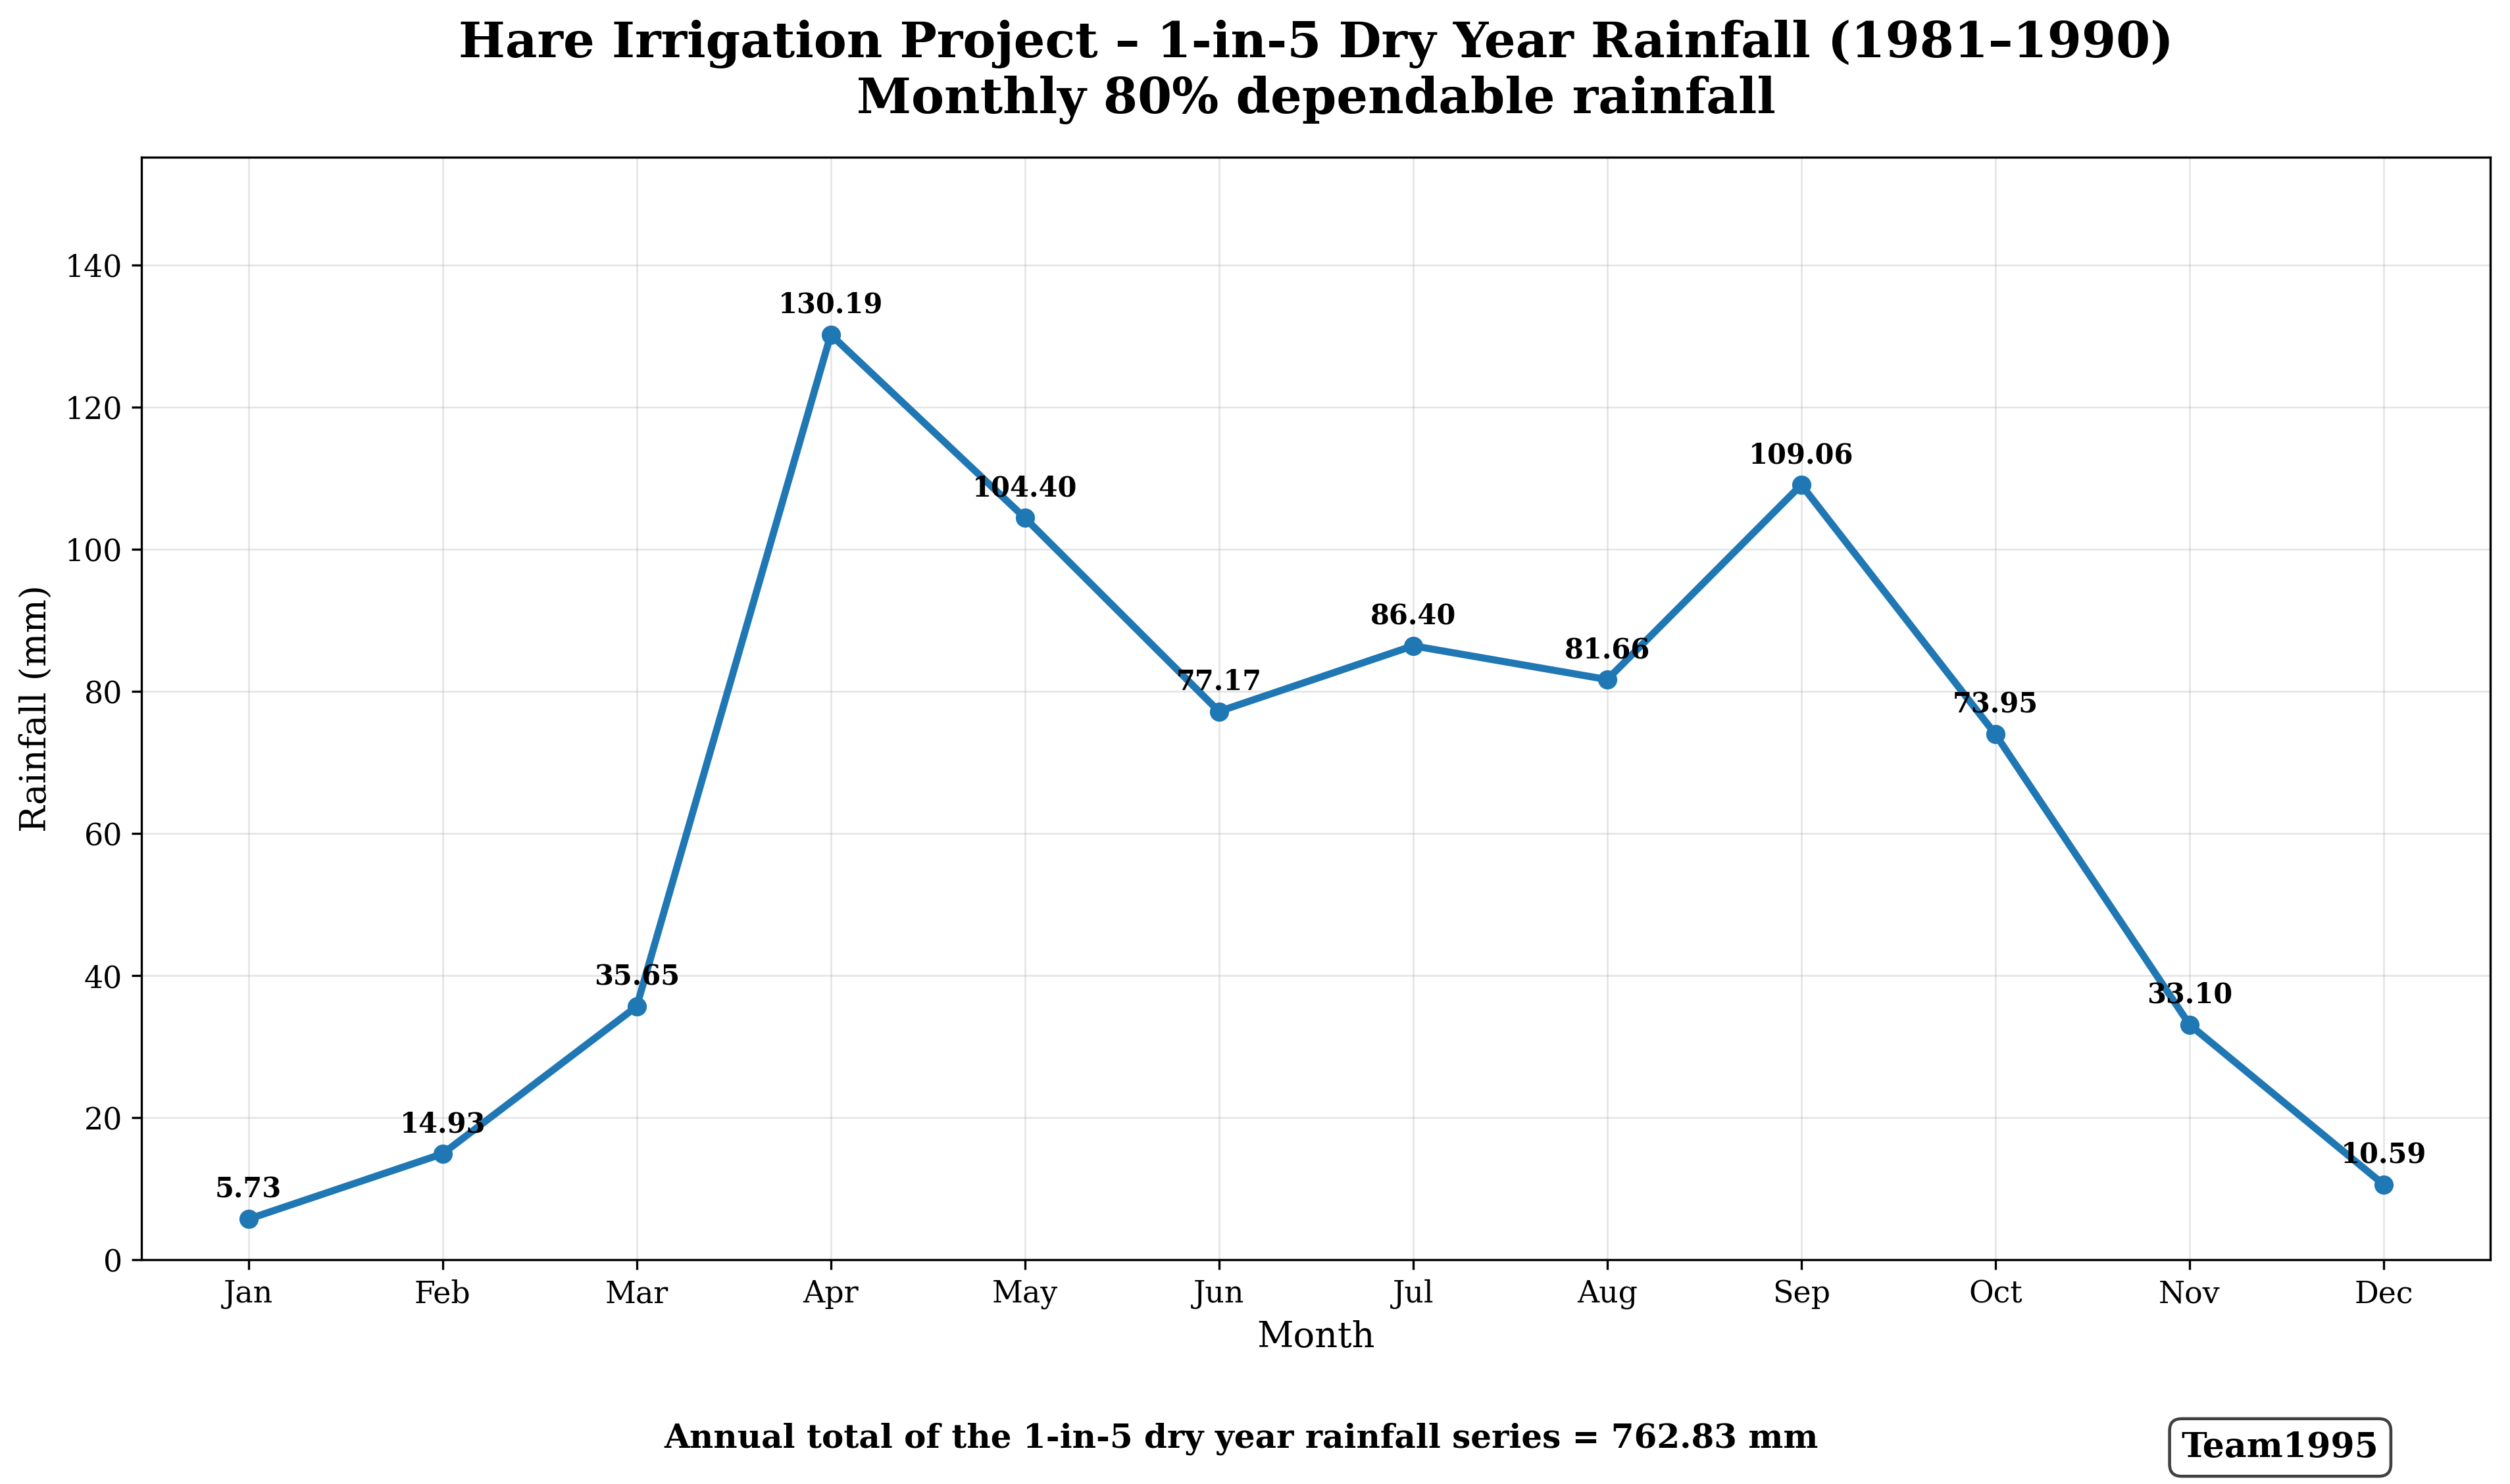
The archive now includes the 1990 annual rainfall distribution map, a monthly rainfall bar chart, a seasonal rainfall line graph and a consolidated watershed statistics figure. Further years and hydroclimatic comparisons can be added progressively.

09

Command Area & Irrigation Layout

Command-area, canal-system, PC1/PC2 profiles & headworks published · hydraulic design ongoing

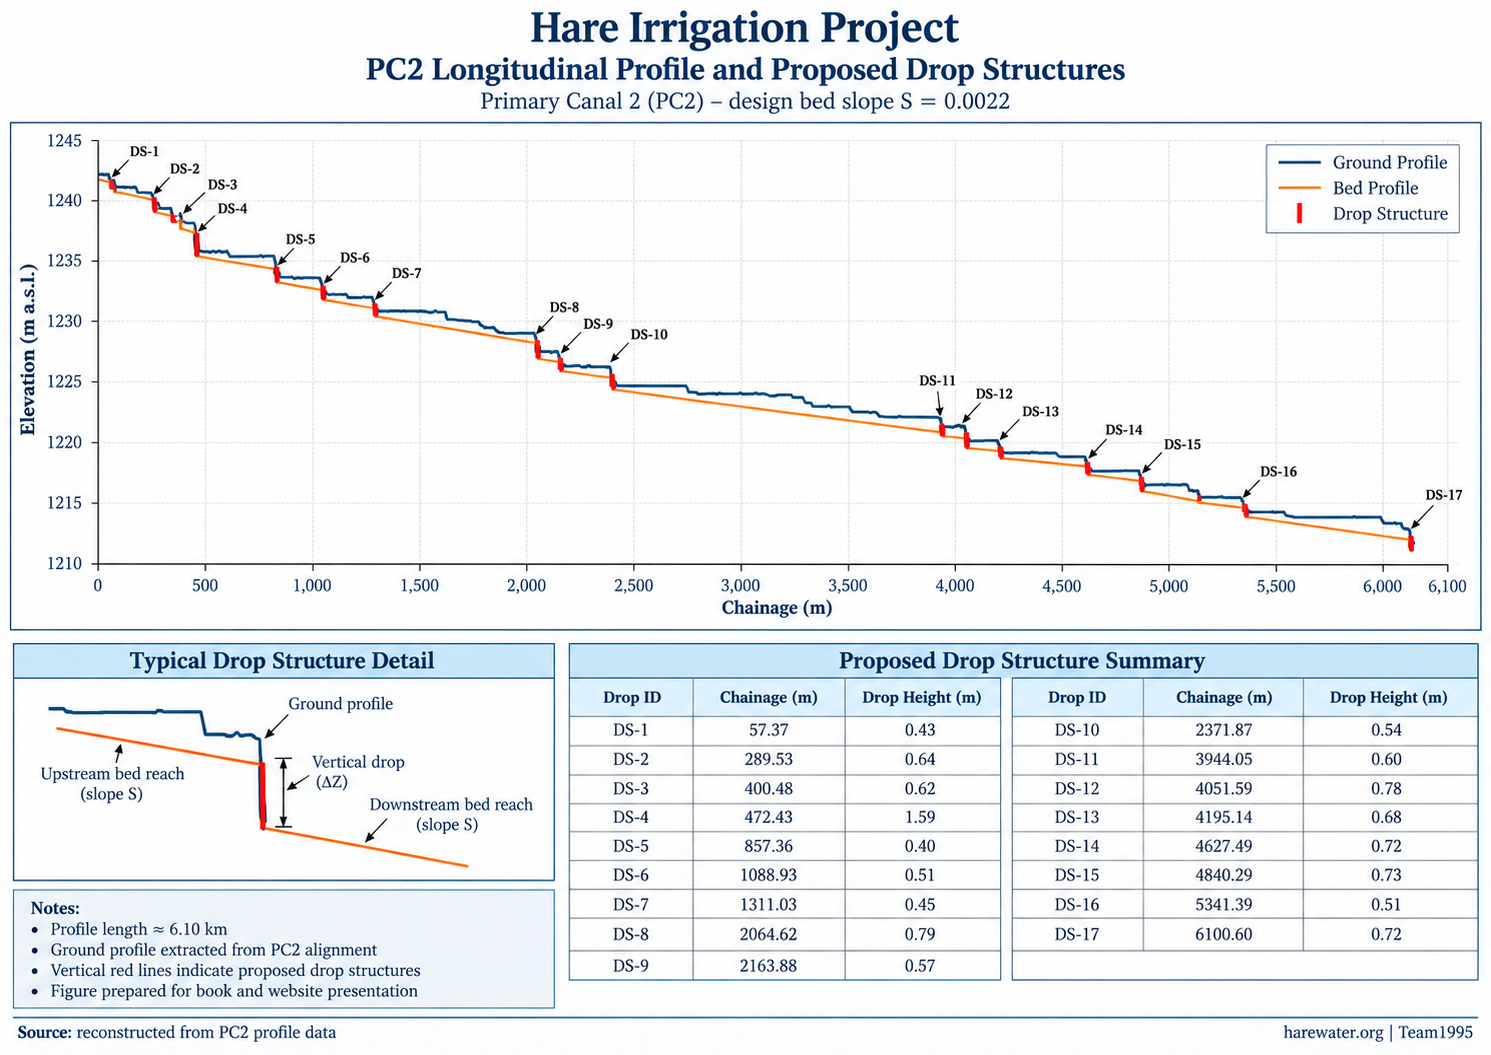
The updated 2026 GIS reassessment delineates a gross HARE command area of approximately 3,384.06 ha. The 10 m land-use raster represents approximately 3,399.69 ha because of raster-cell boundary effects, of which approximately 2,601.40 ha (trees + crops) is treated as preliminary irrigable land. The published canal-system map shows Primary Canal 1 (9.307 km), Primary Canal 2 (5.902 km), Secondary Canal 1 along the ridge (6.129 km), the Hare River, Hare Weir outlet and Hare River mouth on current satellite imagery. The PC1 and PC2 longitudinal-profile figures are now also published, documenting the reconstructed canal-bed profiles and identified drop-structure locations. Detailed hydraulic structures, turnouts, division boxes and chute design remain under development.

10

Hydrological Reassessment

Future analysis

Catchment characteristics, rainfall, flow pathways and hydrological calculations will be recomputed and compared transparently with the original 1995 design study.

HARE spatial workflow

From Source Data to Engineering Interpretation

The modern reassessment will follow a transparent sequence so that each derived map and statistic can be traced back to its source data and processing method.

01
Source Data Select suitable DEM, satellite, rainfall, land-cover, soil and historical project information.
02
DEM Preparation Clip, condition and inspect the elevation model before deriving terrain products.
03
Catchment Delineation Derive flow direction, flow accumulation, drainage network and watershed boundary.
04
Terrain Analysis Calculate elevation, slope, hillshade and terrain summaries.
05
Land & Irrigation Assess land cover, soils, command area, canal alignment and irrigation suitability.
06
Hydrology Revisit rainfall, runoff, dry-flow and flood analyses with modern data and reproducible methods.
07
1995 Comparison Compare modern results with the original HARE calculations, assumptions, maps and design decisions.
HARE Revisited

1995 Engineering Understanding → Modern Spatial Evidence

The modern work is not intended to overwrite the original HARE study. Its purpose is to place the original engineering decisions beside contemporary terrain, satellite, hydrological and GIS evidence so that both the strengths and the limitations of the earlier analysis can be understood clearly.

Original HARE study · 1995

Historical Engineering Evidence

  • Original project maps and drawings
  • Field and site information available to the team
  • Historical rainfall and river-flow records
  • Manual and tabulated calculations
  • Original canal, headworks and irrigation design decisions
  • Engineering interpretation based on the tools available at the time
Modern reassessment · forthcoming

Digital Terrain & Geospatial Evidence

  • Modern DEM and terrain derivatives
  • Digitally delineated watershed and drainage network
  • Satellite-based land-use / land-cover information
  • GIS-based slope, elevation and land analysis
  • Modern rainfall and hydroclimatic datasets
  • Reproducible hydrological and spatial calculations
Planned technical outputs

Published and Planned Technical Outputs

The first integrated watershed map is now part of the archive. As the technical work continues, this portal will expand into a documented geospatial record of the HARE catchment and irrigation system.

Catchment boundary map
Digital elevation model
Elevation-class map
Hillshade map
Slope map
Flow-direction raster
Flow-accumulation raster
Drainage-network map
Land-use / land-cover map
Soil and land-suitability map
Rainfall / hydroclimate maps
Command-area and canal-system map
Canal and headworks reconstruction / overlay
PC1 and PC2 longitudinal profiles / drop-structure schedules
Catchment statistics table
1995 vs modern comparison sheets
Publication principles

Measured First, Published Second

No invented spatial statistics Catchment area, slope classes, land-use percentages, elevations and coordinates will appear only after calculation and verification.
Historical and modern evidence remain distinct Original 1995 information will be clearly separated from new GIS-derived results so that the archive remains technically transparent.
Methods will accompany results Where practical, each map will record its source dataset, processing method, date, spatial resolution and interpretation.

Continue through the HARE Digital Archive

The spatial analysis will connect directly with the preserved project history and the developing HARE engineering book.